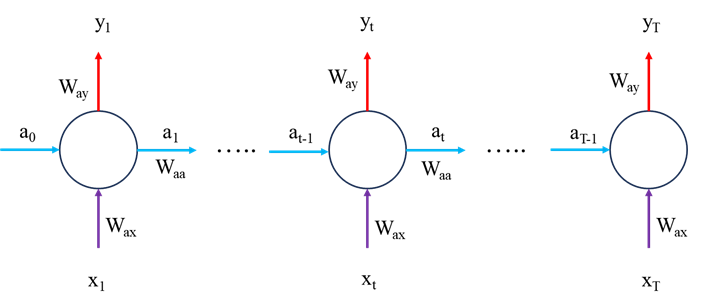
L’implementazione della codifica
Prima di poter implementare le equazioni di cui sopra, dovremo importare il set di dati necessario, preelaborarlo e prepararlo per l’addestramento del modello. Tutto questo lavoro è molto standard in qualsiasi analisi di serie temporali.
import numpy as np
import pandas as pd
import matplotlib.pyplot as plt
import plotly.graph_objs as go
from plotly.offline import iplot
import yfinance as yf
import datetime as dt
import math#### Data Processing
start_date = dt.datetime(2020,4,1)
end_date = dt.datetime(2023,4,1)
#loading from yahoo finance
data = yf.download("GOOGL",start_date, end_date)
pd.set_option('display.max_rows', 4)
pd.set_option('display.max_columns',5)
display(data)
# #Splitting the dataset
training_data_len = math.ceil(len(data) * .8)
train_data = data(:training_data_len).iloc(:,:1)
test_data = data(training_data_len:).iloc(:,:1)
dataset_train = train_data.Open.values
# Reshaping 1D to 2D array
dataset_train = np.reshape(dataset_train, (-1,1))
dataset_train.shape
scaler = MinMaxScaler(feature_range=(0,1))
# scaling dataset
scaled_train = scaler.fit_transform(dataset_train)
dataset_test = test_data.Open.values
dataset_test = np.reshape(dataset_test, (-1,1))
scaled_test = scaler.fit_transform(dataset_test)
X_train = ()
y_train = ()
for i in range(50, len(scaled_train)):
X_train.append(scaled_train(i-50:i, 0))
y_train.append(scaled_train(i, 0))
X_test = ()
y_test = ()
for i in range(50, len(scaled_test)):
X_test.append(scaled_test(i-50:i, 0))
y_test.append(scaled_test(i, 0))
# The data is converted to Numpy array
X_train, y_train = np.array(X_train), np.array(y_train)
#Reshaping
X_train = np.reshape(X_train, (X_train.shape(0), X_train.shape(1),1))
y_train = np.reshape(y_train, (y_train.shape(0),1))
print("X_train :",X_train.shape,"y_train :",y_train.shape)
# The data is converted to numpy array
X_test, y_test = np.array(X_test), np.array(y_test)
#Reshaping
X_test = np.reshape(X_test, (X_test.shape(0), X_test.shape(1),1))
y_test = np.reshape(y_test, (y_test.shape(0),1))
Il modello
Ora implementiamo le equazioni matematiche. vale sicuramente la pena leggere il codice, annotando le dimensioni di tutte le variabili e le rispettive derivate per comprendere meglio queste equazioni.
class SimpleRNN:
def __init__(self,input_dim,output_dim, hidden_dim):
self.input_dim = input_dim
self.output_dim = output_dim
self.hidden_dim = hidden_dim
self.Waa = np.random.randn(hidden_dim, hidden_dim) * 0.01 # we initialise as non-zero to help with training later
self.Wax = np.random.randn(hidden_dim, input_dim) * 0.01
self.Way = np.random.randn(output_dim, hidden_dim) * 0.01
self.ba = np.zeros((hidden_dim, 1))
self.by = 0 # a single value shared over all outputs #np.zeros((hidden_dim, 1))
def FeedForward(self, x):
# let's calculate the hidden states
a = (np.zeros((self.hidden_dim,1)))
y = ()
for ii in range(len(x)):
a_next = np.tanh(np.dot(self.Waa, a(ii))+np.dot(self.Wax,x(ii).reshape(-1,1))+self.ba)
a.append(a_next)
y_local = np.dot(self.Way,a_next)+self.by
y.append(np.dot(self.Way,a_next)+self.by)
# remove the first a and y values used for initialisation
#a = a(1:)
return y, a
def ComputeLossFunction(self, y_pred, y_actual):
# for a normal many to many model:
#loss = np.sum((y_pred - y_actual) ** 2)
# in our case, we are only using the last value so we expect scalar values here rather than a vector
loss = (y_pred(-1) - y_actual) ** 2
return loss
def ComputeGradients(self, a, x, y_pred, y_actual):
# Backpropagation through time
dLdy = ()
dLdby = np.zeros((self.output_dim, 1))
dLdWay = np.random.randn(self.output_dim, self.hidden_dim)/5.0
dLdWax = np.random.randn(self.hidden_dim, self.input_dim)/5.0
dLdWaa = np.zeros((self.hidden_dim, self.hidden_dim))
dLda = np.zeros_like(a)
dLdba = np.zeros((self.hidden_dim, 1))
for t in range(self.hidden_dim-1, 0, -1):
if t == self.hidden_dim-1:
dldy = 2*(y_pred
Fonte: towardsdatascience.com


